

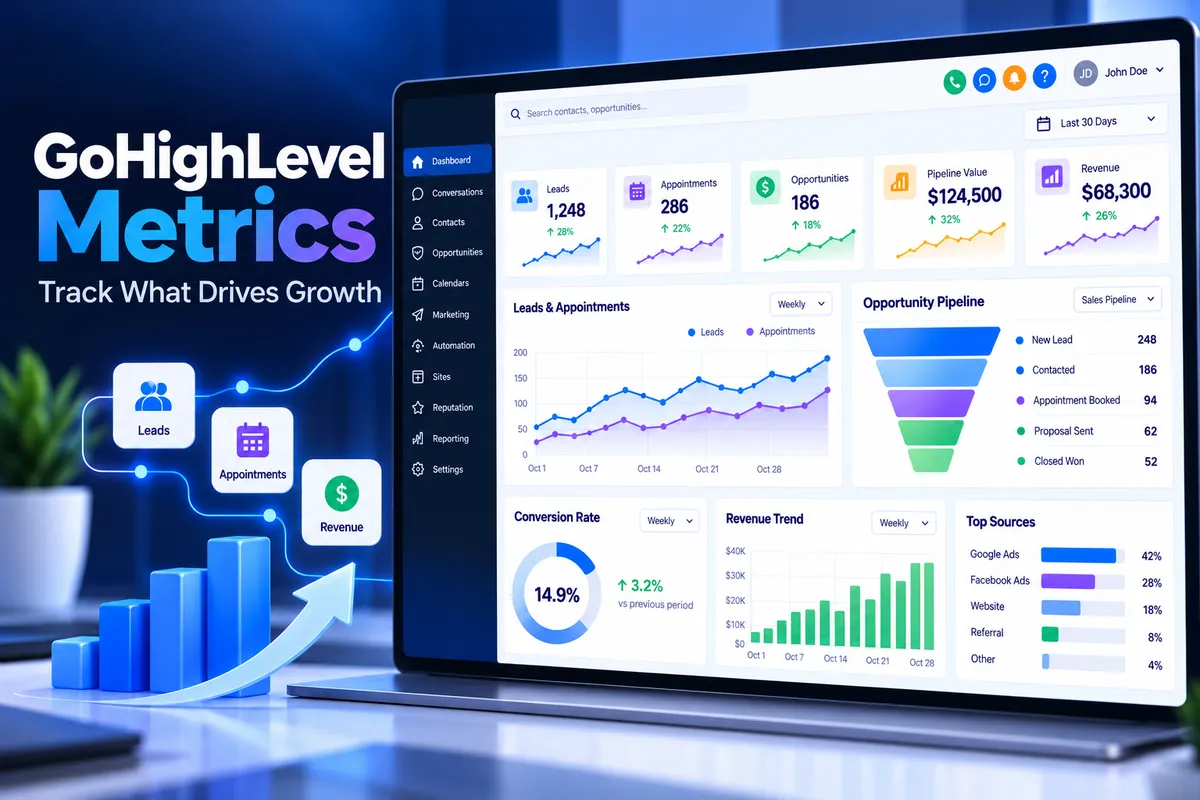
GoHighLevel Reporting: Track the Metrics That Matter
Which GoHighLevel Metrics Should Businesses Track?
Introduction
Businesses can collect a lot of data inside GoHighLevel. The challenge is knowing which numbers actually matter.
Tracking every available metric can make reporting more complicated without making decisions easier. Instead, businesses should focus on a small group of metrics that show whether marketing is attracting the right people, whether leads are moving through the sales process, and whether those activities are producing revenue.
GoHighLevel provides reporting across contacts, appointments, opportunities, funnels, emails, calls, conversations, advertising, and other areas. Its dashboards and reports can also be customized to focus on the metrics most relevant to a business.
This guide explains the most useful GoHighLevel metrics to track, what they tell you, and how to use them to make better marketing and sales decisions.
Why Tracking the Right Metrics Matters
A dashboard full of numbers doesn't automatically give you useful insight.
For example, getting more leads sounds positive. But if those leads rarely book appointments or become customers, increasing lead volume may not solve the real problem.
A better approach is to look at the customer journey:
Traffic → Lead → Appointment → Opportunity → Won Deal → Revenue
Each stage gives you a different measurement point.
By monitoring these stages together, you can identify where prospects are progressing and where they are dropping off.
GoHighLevel's reporting tools can help businesses analyze these areas through dashboards, opportunity widgets, funnel analytics, campaign statistics, and attribution data.
1. Lead and Contact Metrics
The first numbers to monitor are related to lead generation.
New Leads
Track how many new contacts your business is generating during a specific period.
This helps answer:
Are marketing campaigns generating interest?
Is lead volume increasing or decreasing?
Which periods generate the most leads?
Are different lead sources producing different results?
However, lead volume should not be treated as the final measure of marketing success.
A business could generate hundreds of leads while producing very few sales. That's why lead metrics should be connected to downstream metrics such as appointments, opportunities, and revenue.
Lead Source
Knowing where leads come from is just as important as knowing how many you have.
GoHighLevel supports lead-source and attribution reporting, including filters based on attribution and UTM information in supported widgets. This can help businesses analyze contacts and opportunities according to how people discovered or interacted with the business.
For example, you might compare leads from:
Google Ads
Facebook or Instagram
Organic search
Referral traffic
Direct traffic
Specific campaigns
This gives you a better understanding of where your opportunities are coming from, rather than simply counting contacts.
2. Funnel Conversion Metrics
If your business uses GoHighLevel funnels, websites, forms, or surveys, conversion metrics are essential.
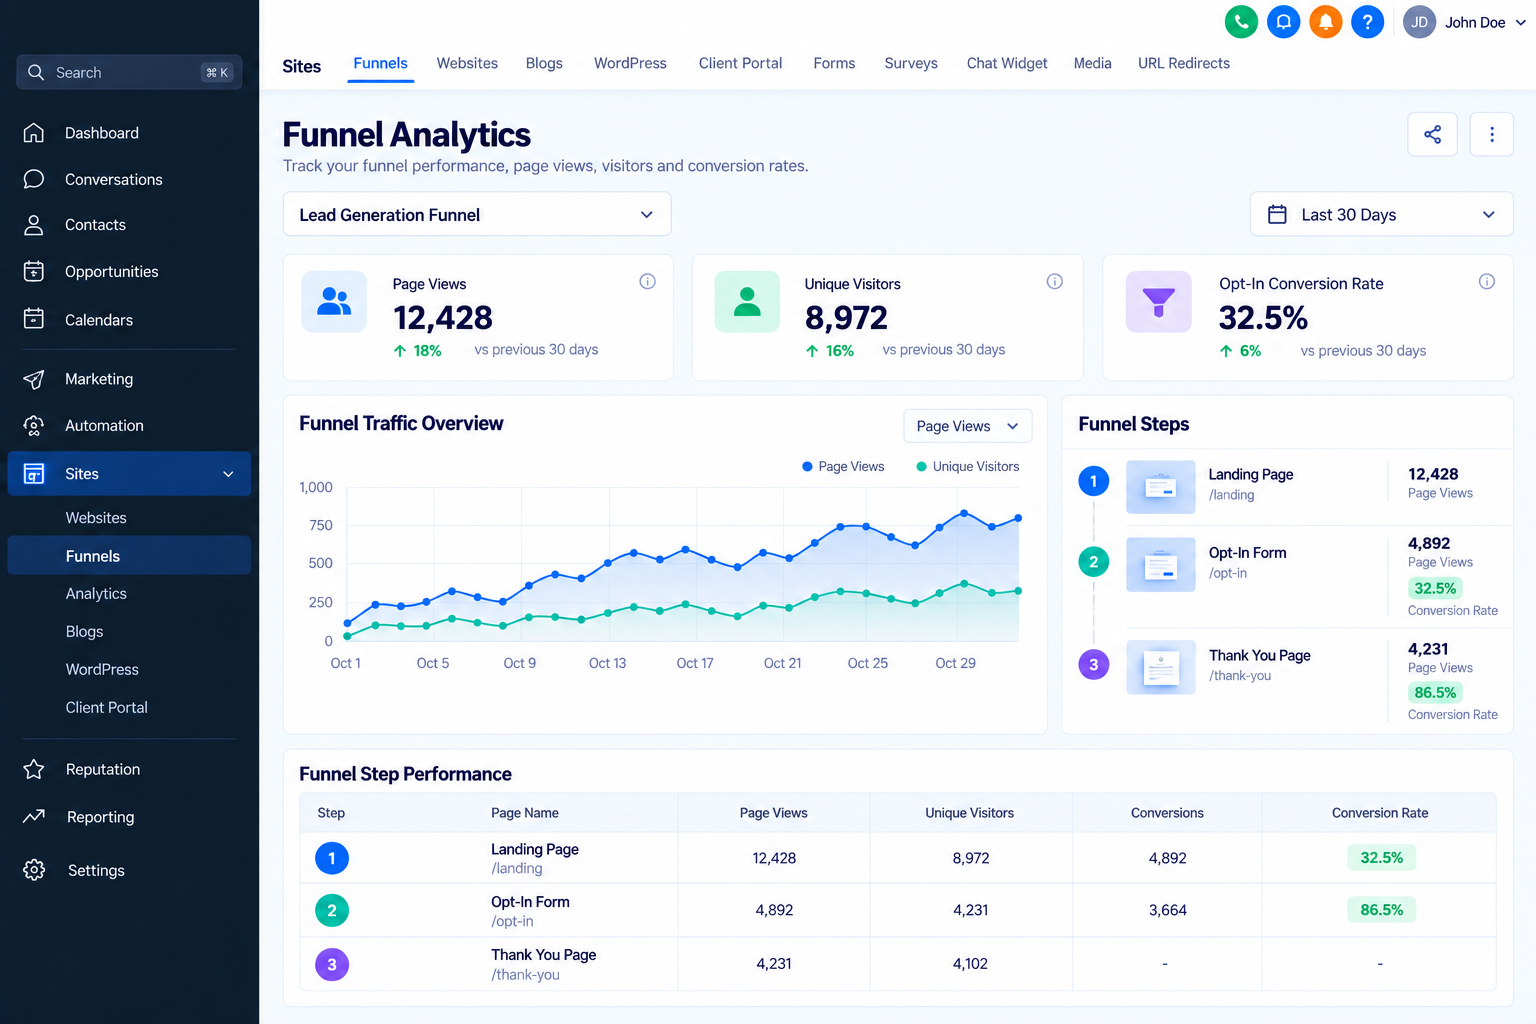
GoHighLevel's Site & Funnel Analytics can show metrics such as page views, opt-ins, sales, time on page, and opt-in conversion rate.
Page Views
Page views tell you how much traffic an asset receives.
GoHighLevel distinguishes between total and unique page views in funnel statistics. This helps separate overall visits from unique visitors.
Page views are useful for understanding traffic, but traffic alone doesn't indicate whether the page is effective.
Opt-In Conversion Rate
This is one of the more useful funnel metrics.
It shows how effectively visitors take a desired action, such as submitting a form, survey, or booking an appointment, depending on the asset and reporting context.
GoHighLevel's funnel statistics calculate opt-in rate using opt-ins relative to unique page views.
If traffic is increasing while conversion rate is falling, the problem may be on the page rather than with traffic generation.
3. Appointment Metrics
For appointment-based businesses, booking performance deserves close attention.
Track metrics such as:
Appointments booked
Appointment trends
Appointment outcomes
No-show activity
Appointment-related conversion performance
The exact metrics available can vary depending on the reporting view and configuration.
The important question is:
Are leads turning into actual conversations or meetings?
For example, suppose a campaign generates 100 leads but only five appointments. Increasing lead volume may not be the best next step.
Instead, investigate the qualification, follow-up, offer, booking process, or communication between the lead and the business.
4. Opportunity Metrics
Opportunity reporting is particularly valuable for businesses with a sales pipeline.
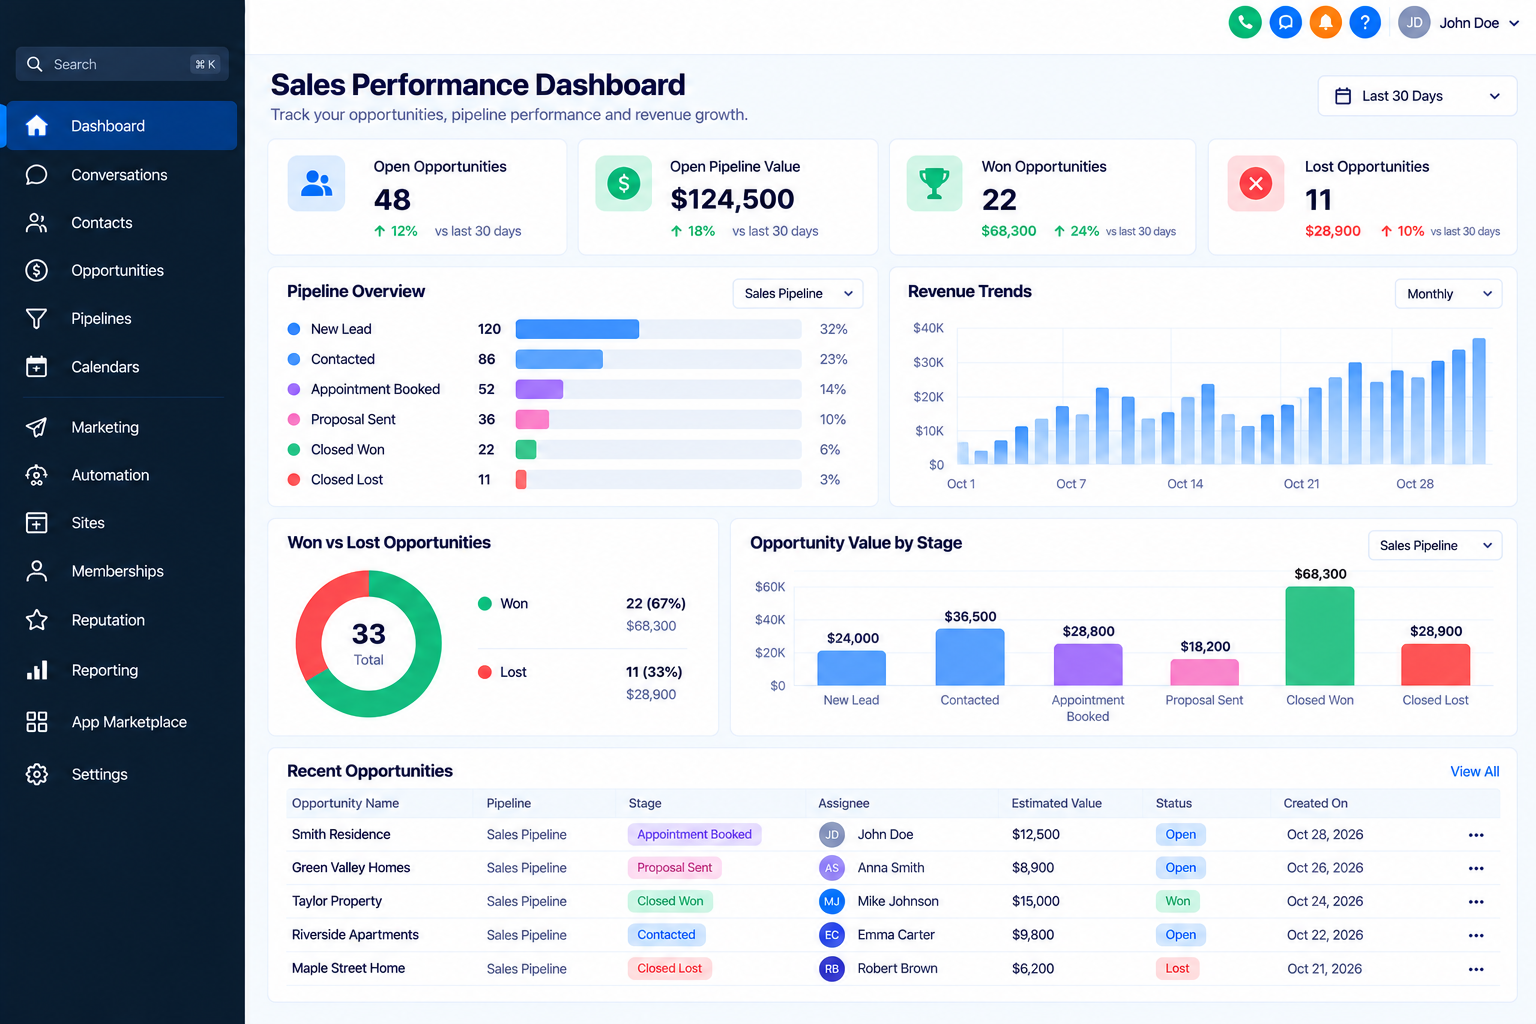
GoHighLevel provides opportunity widgets that can show opportunity counts, status distribution, opportunity value, revenue trends, and other pipeline information. These widgets can also be filtered by factors such as pipeline, stage, status, assignee, and attribution source.
Open Opportunities
This tells you how many opportunities are currently active.
A growing number can indicate a healthy pipeline, but it can also reveal a problem if opportunities remain stuck for too long.
Won Opportunities
Won opportunities represent deals that successfully reached the Won status.
This is much more meaningful than simply counting leads because it connects the sales process to actual outcomes.
Lost Opportunities
Lost opportunities help identify where potential revenue is being missed.
Reviewing lost opportunities alongside their stages, sources, and lost reasons can help reveal patterns in the sales process.
Opportunity Value
Opportunity value helps estimate the monetary value associated with opportunities.
GoHighLevel provides widgets for opened opportunity value, lost opportunity value, won opportunity value, total opportunity value, and other opportunity-value views.
This allows a business to look beyond the number of deals and understand their potential financial impact.
5. Sales Conversion Rate
One of the most important questions for any business is:
How many opportunities are becoming customers?
GoHighLevel provides conversion-rate reporting through its dashboard and reporting tools. Its Funnel widget can also show progression through sequential pipeline stages and help identify conversion drop-offs.
For example:
100 opportunities → 25 won deals = 25% conversion
The exact calculation and reporting context should always be considered because different reports may measure different stages or populations.
A declining conversion rate may indicate issues with:
Lead quality
Sales follow-up
Qualification
Pricing
Offer positioning
Sales process
Pipeline management
That's why conversion rate is more useful when viewed alongside lead source and pipeline-stage data.
6. Revenue Metrics
Revenue is ultimately one of the most important business measurements.
GoHighLevel opportunity reporting includes revenue-related views such as opportunity revenue over time and won opportunity value.
Businesses should monitor:
Won revenue
Opportunity value
Revenue trends
Revenue by relevant source or segment
Revenue associated with marketing activity where attribution is available
Revenue helps answer a much more important question than "How many leads did we generate?"
It asks:
"Did our marketing and sales activity produce business results?"
7. Email Conversion and Revenue Metrics
For businesses using email campaigns, opens and clicks can provide useful engagement information, but conversions and revenue are often more valuable.
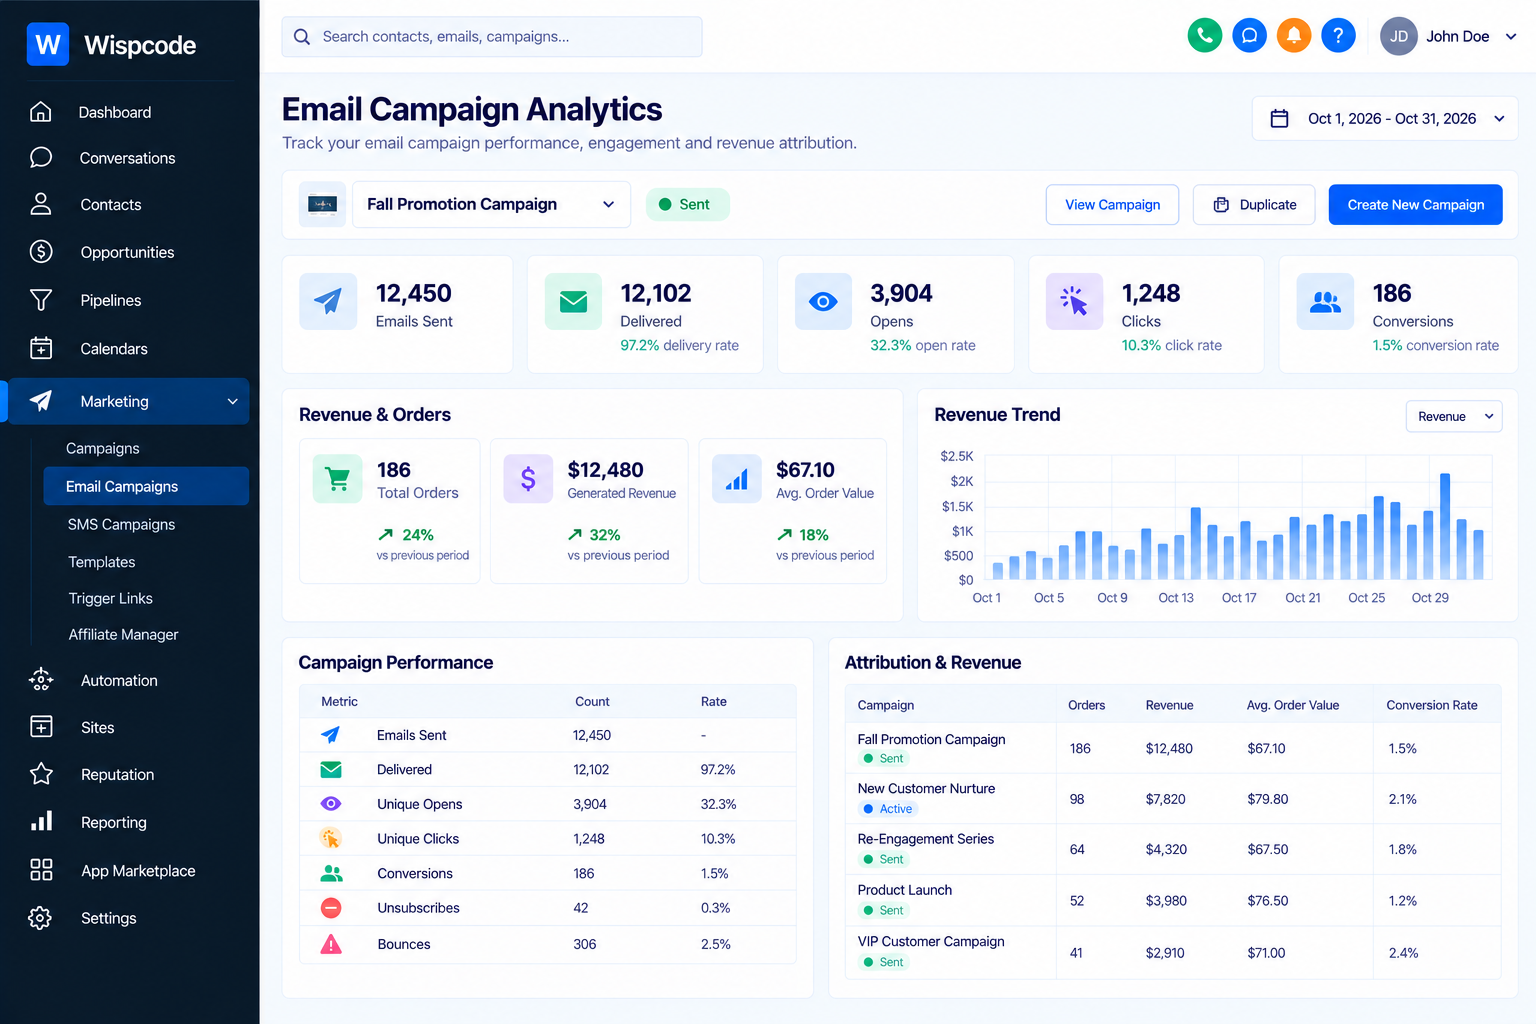
HighLevel's email conversion and revenue attribution reporting can connect eligible purchases to qualifying email interactions within an attribution window. Current HighLevel documentation states that the default attribution window is five days and can be customized.
Available email conversion metrics include:
Orders/conversions
Revenue
Revenue per recipient
Conversion/order rate
Average order value
These metrics can help you determine whether an email campaign is producing meaningful business outcomes rather than simply generating engagement.
8. Paid Advertising Metrics
If a business runs paid advertising, ad performance should be reviewed alongside CRM and sales data.
HighLevel provides Google Ads reporting widgets covering metrics such as spend, clicks, impressions, conversions, CPC, and campaign-level performance.
Similarly, HighLevel's Meta ad widgets can display metrics including clicks, conversions, spend, impressions, reach, CPC, CPM, and cost per conversion.
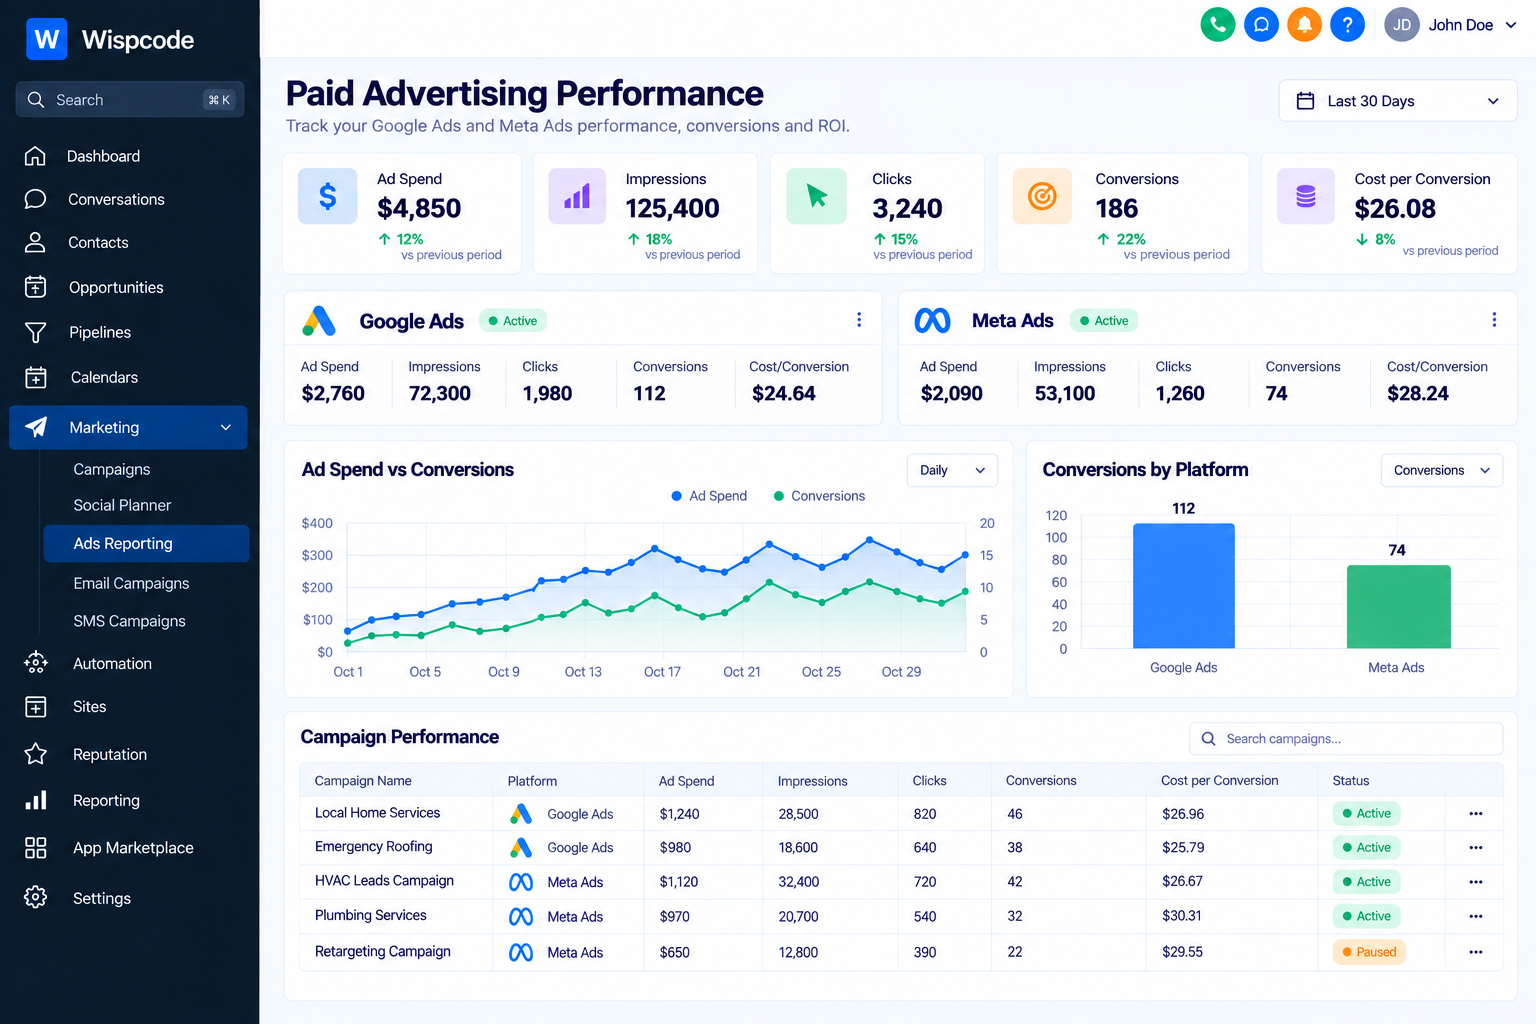
Important advertising metrics include:
Ad Spend
How much money is being invested in advertising?
Clicks
Are people interacting with the advertisements?
Cost Per Click
How much does each click cost on average?
Conversions
How many tracked conversion actions are being attributed to the advertising activity?
Cost Per Conversion
How much advertising spend is associated with each reported conversion?
These metrics become more useful when combined with CRM outcomes. A campaign can generate inexpensive leads but still produce poor sales results.
9. Customer Acquisition and Business-Level KPIs
Once your basic reporting is working, you can combine metrics to create more meaningful business KPIs.
For example, HighLevel's Custom Metrics feature allows supported accounts to combine metrics and formulas into custom dashboard measurements. HighLevel documentation gives examples such as calculating conversion rates from won opportunities and new leads.
Possible business-level measurements include:
Lead-to-customer conversion
Cost per acquisition
Revenue per lead
Return on advertising spend
Revenue growth
Sales efficiency
These calculations should be based on clearly defined inputs. A custom metric is only useful when everyone understands exactly what it measures.
How to Build a Simple GoHighLevel KPI Dashboard
You don't need dozens of widgets.
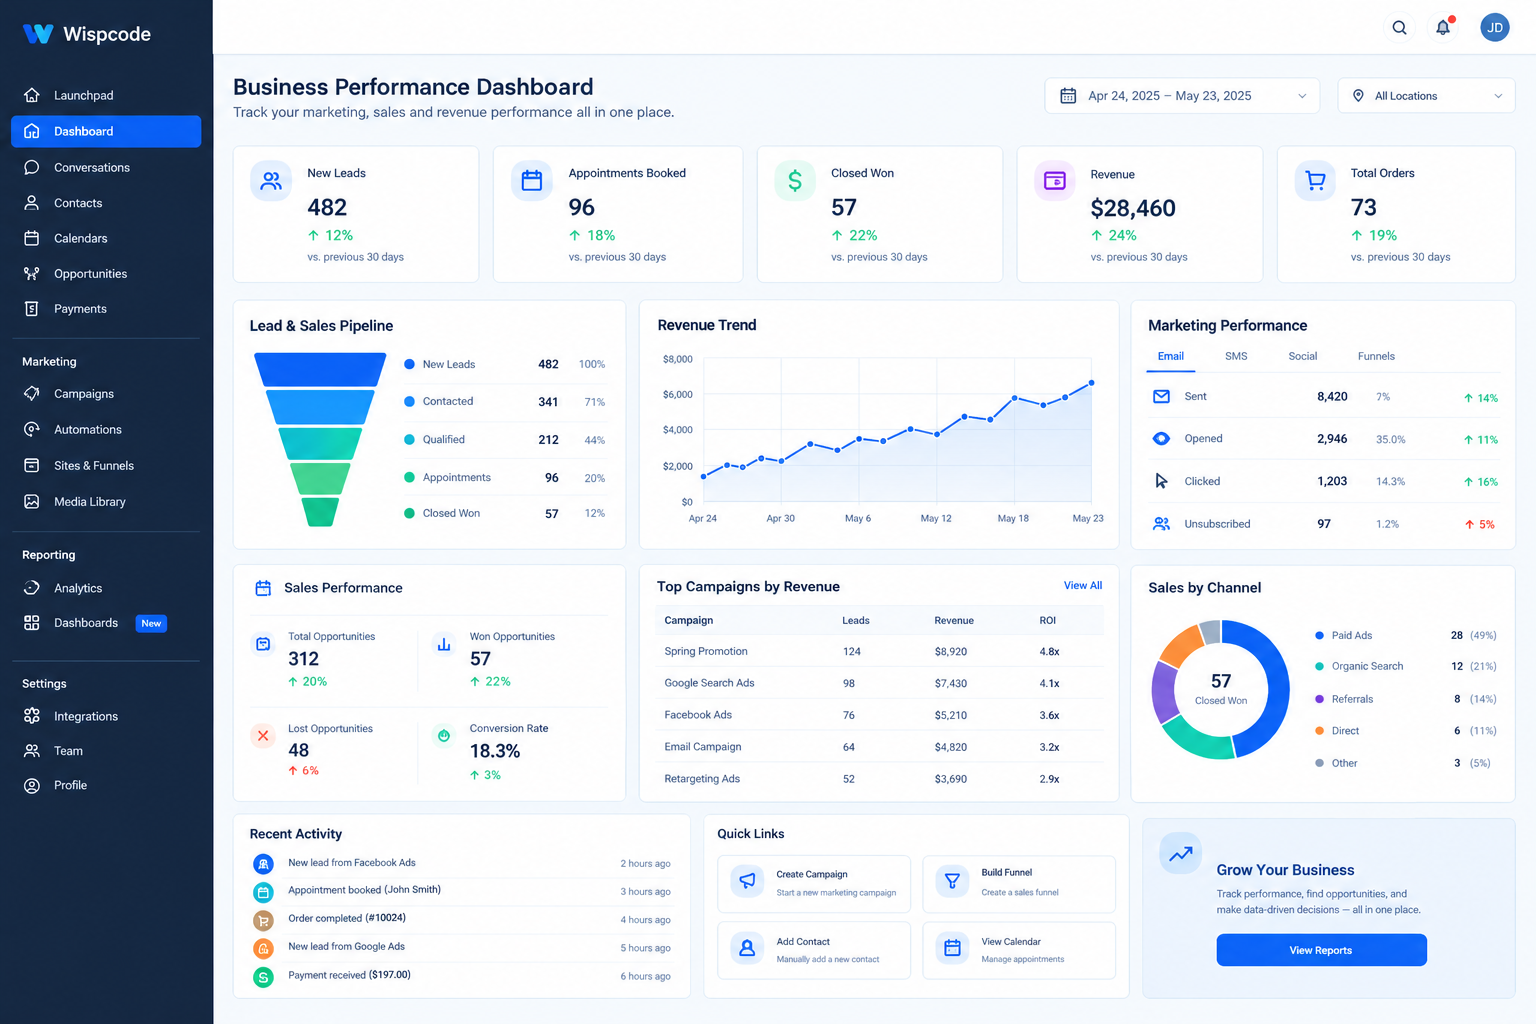
A practical dashboard could begin with:
Marketing
New leads
Lead source
Page views
Opt-in conversion rate
Sales
Open opportunities
Won opportunities
Lost opportunities
Opportunity value
Conversion rate
Revenue
Won opportunity value
Revenue trends
Relevant purchase or campaign revenue
Advertising
Ad spend
Clicks
Conversions
Cost per conversion
From there, add metrics only when they help answer a specific business question.
How Often Should You Review Your Metrics?
Not every metric needs to be checked every day.
A practical reporting rhythm could be:
Daily: Check leads, appointments, urgent pipeline activity, and major campaign issues.
Weekly: Review conversion rates, opportunity movement, lead sources, advertising performance, and sales activity.
Monthly: Analyze revenue, pipeline performance, acquisition efficiency, and broader trends.
The exact schedule should depend on the business's sales cycle and marketing volume.
Common Mistakes When Tracking GoHighLevel Metrics
Tracking Too Many Numbers
More metrics don't necessarily mean better decisions.
Focus on KPIs that connect directly to business objectives.
Measuring Leads Without Sales
Lead generation is only one stage of the customer journey.
Always connect lead volume to appointments, opportunities, conversions, and revenue where possible.
Ignoring Lead Sources
Two channels can generate the same number of leads but produce completely different sales results.
Looking at Short Time Periods
A single day may not provide enough context. Compare appropriate date ranges and look for meaningful trends.
Confusing Revenue With ROI
Revenue attribution isn't automatically the same as return on investment. HighLevel specifically notes that attributed revenue does not equal ROI because ROI also requires cost or spend information.
Frequently Asked Questions(FAQ's)
1. What are the most important GoHighLevel metrics to track?
Start with leads, appointments, opportunities, conversion rates, opportunity value, won revenue, lead sources, and relevant marketing performance.
2. Should businesses track every GoHighLevel metric?
No. Focus on metrics that directly help you understand marketing, sales, customer acquisition, and revenue.
3. Can GoHighLevel track lead sources?
Yes. Supported reporting tools can use source, attribution, and UTM information to analyze contacts and opportunities.
4. Can GoHighLevel track funnel conversion rates?
Yes. Funnel and website analytics include opt-ins and conversion-related metrics, with available measurements depending on the asset and reporting view.
5. Can GoHighLevel create custom KPIs?
Yes. GoHighLevel's Custom Metrics feature allows supported accounts to combine metrics and formulas into custom dashboard measurements.
Conclusion
The goal of GoHighLevel reporting isn't to collect the biggest possible number of statistics. It's to understand what is happening in your marketing and sales process and what needs to improve.
Start with the fundamentals: leads, appointments, opportunities, conversion rates, pipeline value, revenue, and lead sources. Then add funnel, email, advertising, or custom metrics when they provide additional insight.
Most importantly, don't analyze each metric in isolation.
A healthy reporting system connects the journey:
Traffic → Leads → Appointments → Opportunities → Won Deals → Revenue
When those numbers are viewed together, GoHighLevel becomes more than a place to store CRM data. It becomes a practical system for identifying bottlenecks, measuring performance, and making better business decisions.
Need Expert Help with GoHighLevel?
New to GoHighLevel and ready to get started? Buy your GoHighLevel account here and launch with confidence.
Already know what you need and want our team to handle everything, from complete setup and customization to funnels, workflows, automations, CRM, and pipelines? Click here.