

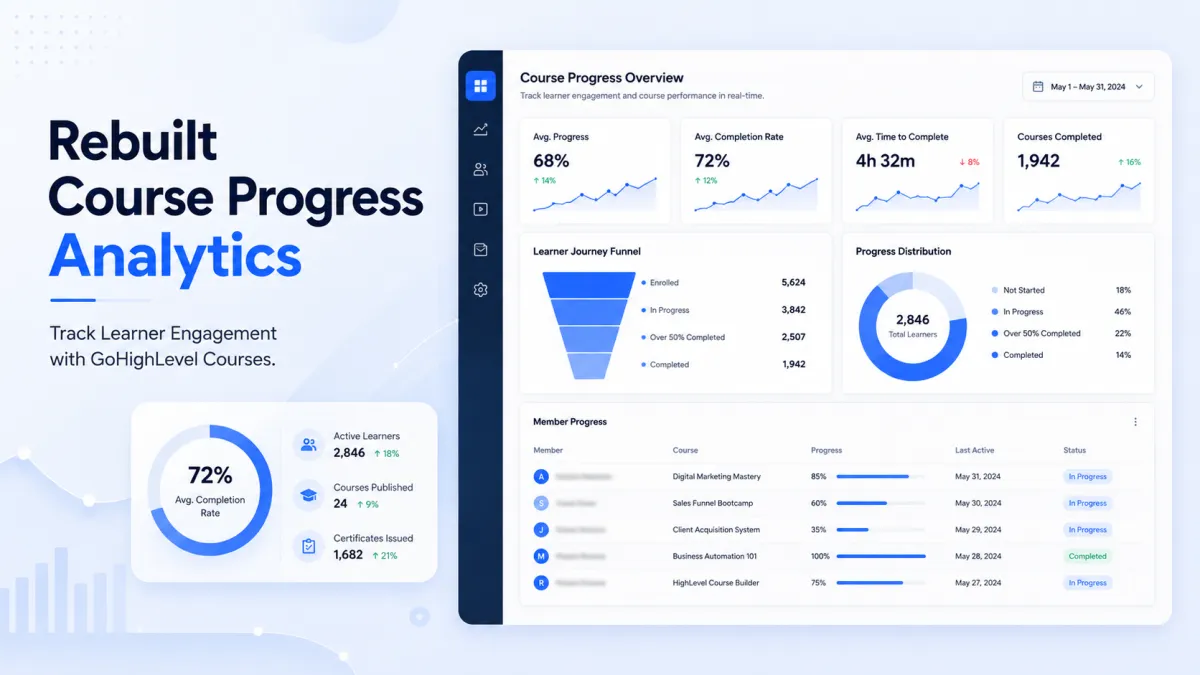
Course Progress Analytics
Rebuilt Course Progress Analytics in GoHighLevel: A Smarter Way to Track Learner Engagement
Introduction
GoHighLevel continues to improve its learning platform with the release of Rebuilt Course Progress Analytics, a redesigned analytics experience for GoHighLevel Courses. This update provides a faster and more reliable way to understand how learners engage with course content, helping users monitor progress from a centralized dashboard.
The new Course Progress Analytics experience brings together important learner data, progress metrics, and reporting tools in one place. From tracking completion trends to identifying where learners drop off, the rebuilt analytics dashboard is designed to make course insights easier to access and understand.
If you use GoHighLevel Memberships to deliver courses, this latest GoHighLevel Update introduces a more streamlined way to review learner activity and course performance.
What is Rebuilt Course Progress Analytics?
Rebuilt Course Progress Analytics is a newly available analytics experience for GoHighLevel Courses. According to the official update, it offers a faster and more reliable way to understand learner engagement across your courses.
The rebuilt dashboard allows users to:
Track course completion trends
Identify learner drop-offs
Drill into individual learner progress
All of this information is available from a single dashboard, making it easier to review learner activity without switching between multiple areas.
What's New?
The latest GoHighLevel Course Analytics update introduces several improvements that make learner data more organized and easier to review.
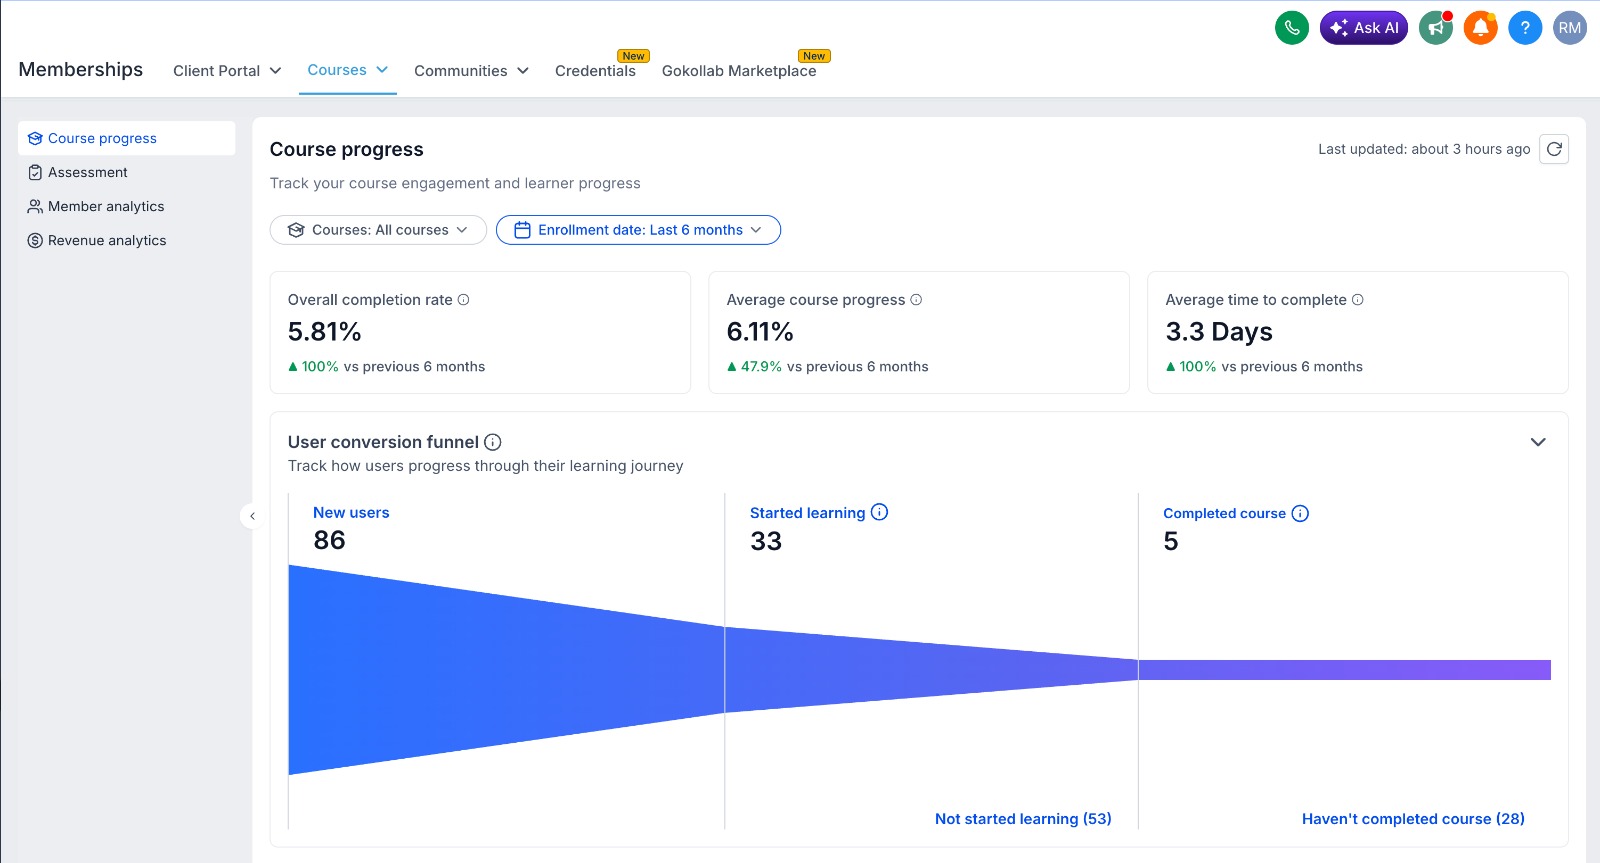
Unified Dashboard
The rebuilt experience introduces a Unified Dashboard that brings course progress information into one centralized location.
Instead of viewing information across separate areas, users can access learner progress, key metrics, and reports from a single dashboard designed specifically for Course Progress Analytics.
Course and Enrollment Date Filters
The dashboard includes filters for:
Course
Enrollment Date
These filters allow users to narrow the displayed information based on the selected course or enrollment period, making it easier to review specific data.
Key Metrics
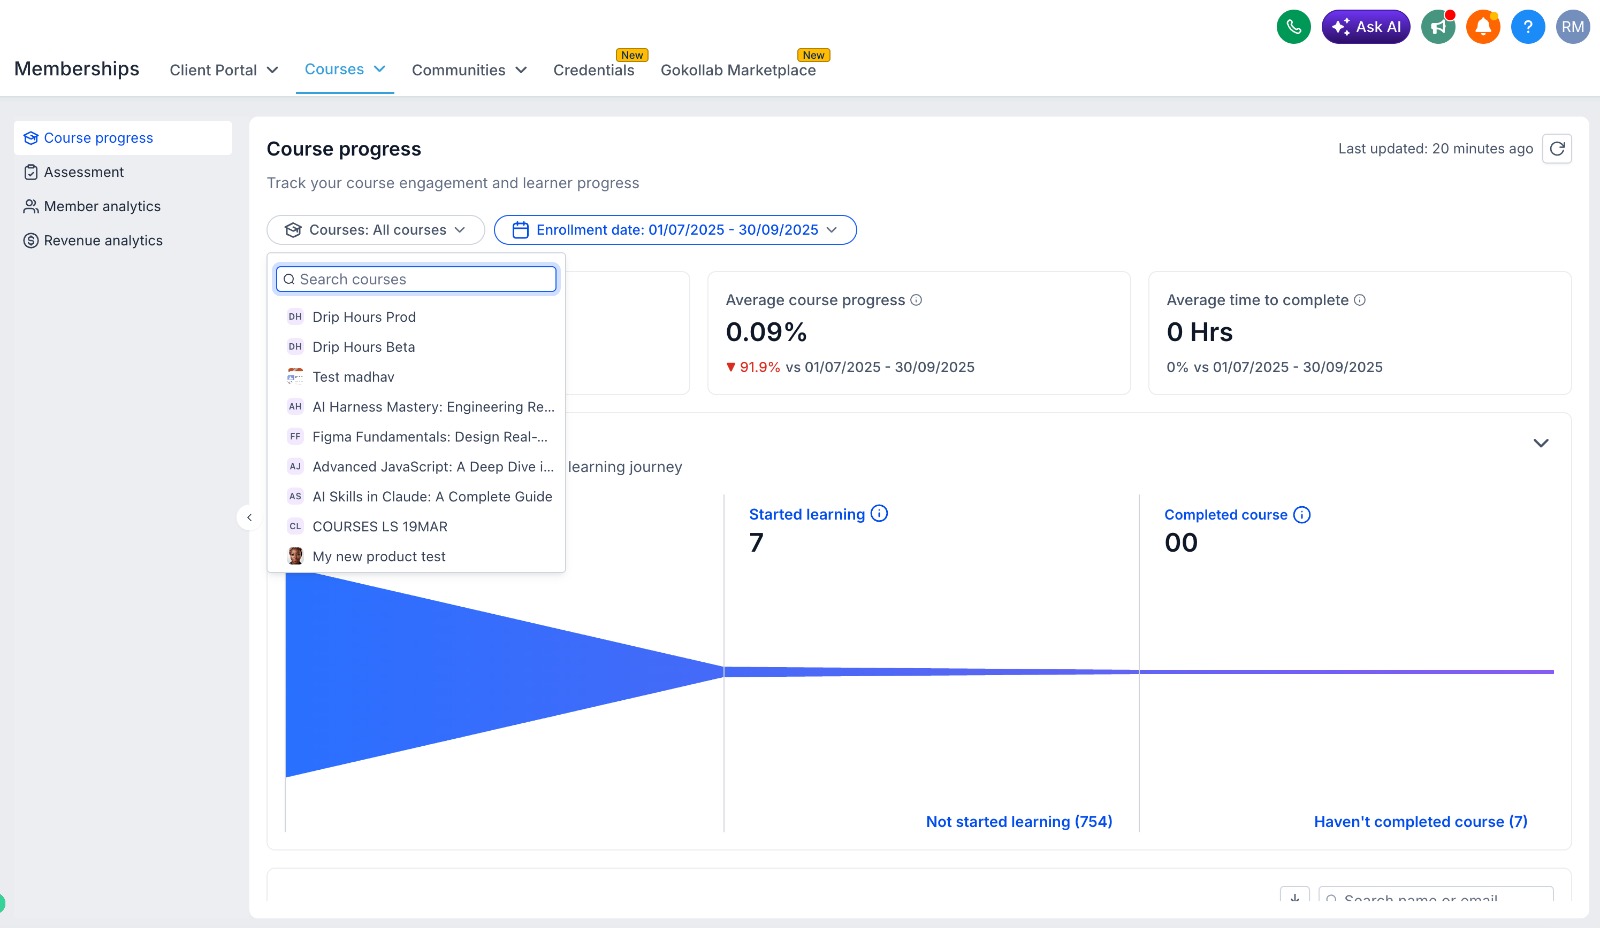
The new analytics dashboard includes several important performance metrics that help summarize learner progress.
These include:
Completion Rate
Average Progress
Time to Complete
The dashboard also includes period-over-period comparisons, allowing users to compare these metrics across different time periods.
Learner Journey Funnel
Another addition is the Learner Journey Funnel, which visualizes learner progression through three stages:
Enrolled
Started
Completed
This funnel provides a clear overview of how learners move through the course journey.
Member Progress Table
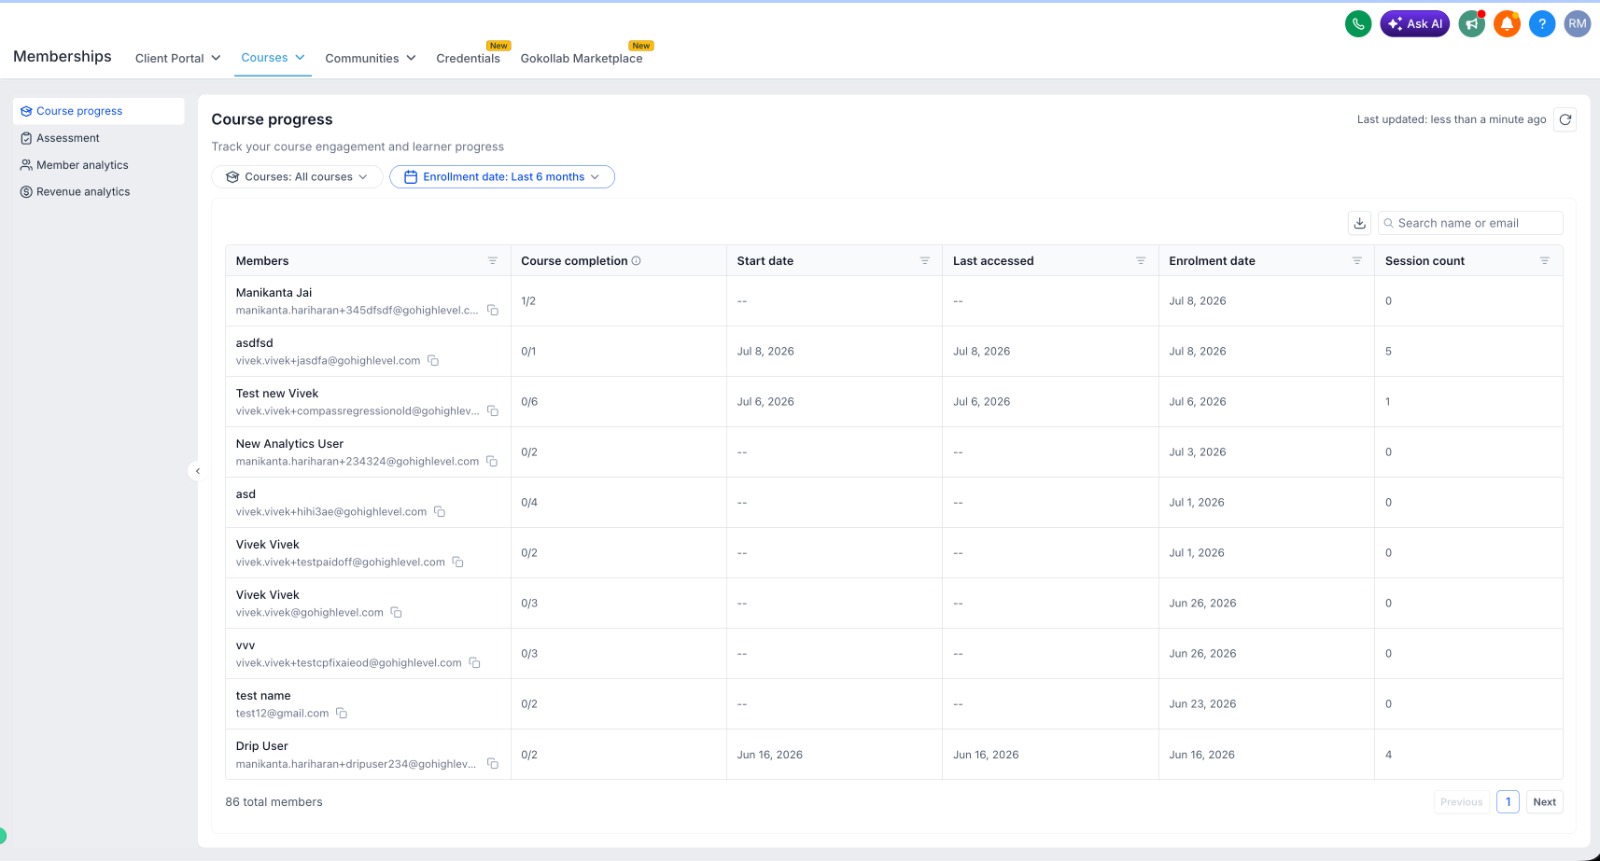
The rebuilt analytics experience also introduces a Member Progress Table.
According to the official update, this table includes details related to:
Enrollment
Activity
Completion
Session information
This makes it easier to review individual learner progress within the analytics dashboard.
CSV Export
Users can also export filtered reports using the new CSV Export feature.
For larger exports, the reports are delivered through email, providing an additional option for accessing exported analytics data.
Faster Performance
Along with new reporting capabilities, the rebuilt GoHighLevel Learning Analytics experience includes notable performance improvements.
According to the official release, users can expect:
Approximately 43% faster page loads
Approximately 90% less data downloaded
A smoother and more responsive analytics experience
These improvements are intended to make navigating the analytics dashboard faster while reducing the amount of data required to load reports.
Why This Update Matters
The official announcement highlights several reasons why the rebuilt Course Progress Analytics experience is valuable.
Measure Learner Engagement from One Place
The unified dashboard allows users to review learner engagement from a single location, making course progress easier to monitor.
Identify Learners Who May Need Attention
The analytics experience helps users identify learners who may need attention before they disengage by making learner progress and drop-offs easier to review.
Make Data-Driven Course Improvements
With access to completion trends, learner progress, and key metrics, users can make data-driven improvements to their courses based on the available analytics.
Export Insights to Share with Teams
The CSV Export feature also allows users to export filtered reports, making it easier to share analytics insights with team members when needed.
Availability
The new Rebuilt Course Progress Analytics experience is available through Labs.
To access the feature:
Enable New Course Progress Analytics in Labs.
Navigate to:
Memberships → Courses → Analytics → Course Progress
Once enabled, users can begin using the rebuilt analytics dashboard through the Course Progress section.
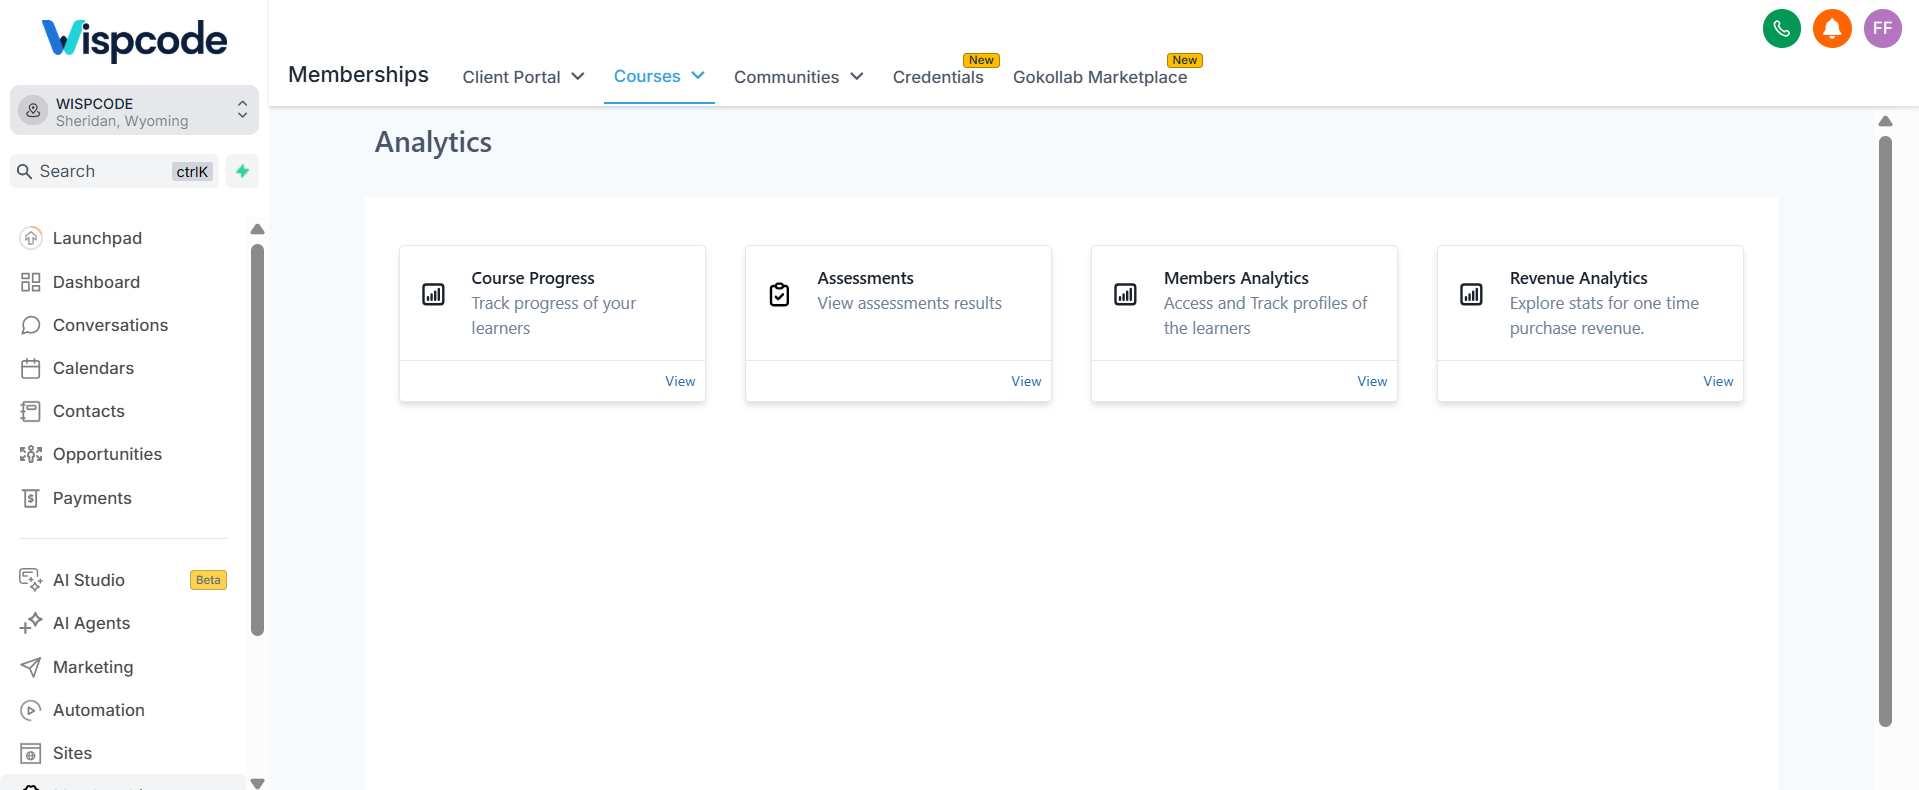
Coming Next
GoHighLevel has also shared what's planned for the future of the Courses analytics experience.
The next additions will include:
Assessment Analytics
Revenue Analytics
According to the official update, these features are planned as the next additions to complete the overall Courses analytics experience.
Frequently Asked Questions (FAQs)
1. What is Rebuilt Course Progress Analytics?
It is GoHighLevel's new analytics dashboard for tracking learner progress and course engagement.
2. What metrics does the dashboard include?
It includes Completion Rate, Average Progress, Time to Complete, and period-over-period comparisons.
3. Can I export analytics reports?
Yes. You can export filtered reports as CSV files, with larger exports delivered by email.
4. How do I access Course Progress Analytics?
Enable New Course Progress Analytics in Labs, then go to Memberships → Courses→Analytics→ Course Progress.
5. What analytics features are coming next?
GoHighLevel has announced Assessment Analytics and Revenue Analytics as upcoming additions.
Conclusion
The release of Rebuilt Course Progress Analytics marks an important improvement to GoHighLevel Courses, delivering a faster and more organized way to understand learner engagement. With a unified dashboard, built-in filters, key performance metrics, a learner journey funnel, member progress details, and CSV export capabilities, the new analytics experience brings course insights together in one place.
In addition to new reporting features, GoHighLevel reports approximately 43% faster page loads, approximately 90% less data downloaded, and a smoother overall analytics experience. Users can enable the feature in Labs and access it through Memberships → Courses → Analytics → Course Progress. If the feature is available in your account, it's worth exploring the rebuilt dashboard to take advantage of the latest improvements in GoHighLevel Course Analytics.
Need Expert Help with GoHighLevel?
New to GoHighLevel and ready to get started? Buy your GoHighLevel account here and launch with confidence.
Already know what you need and want our team to handle everything, from complete setup and customization to funnels, workflows, automations, CRM, and pipelines? Click here.