

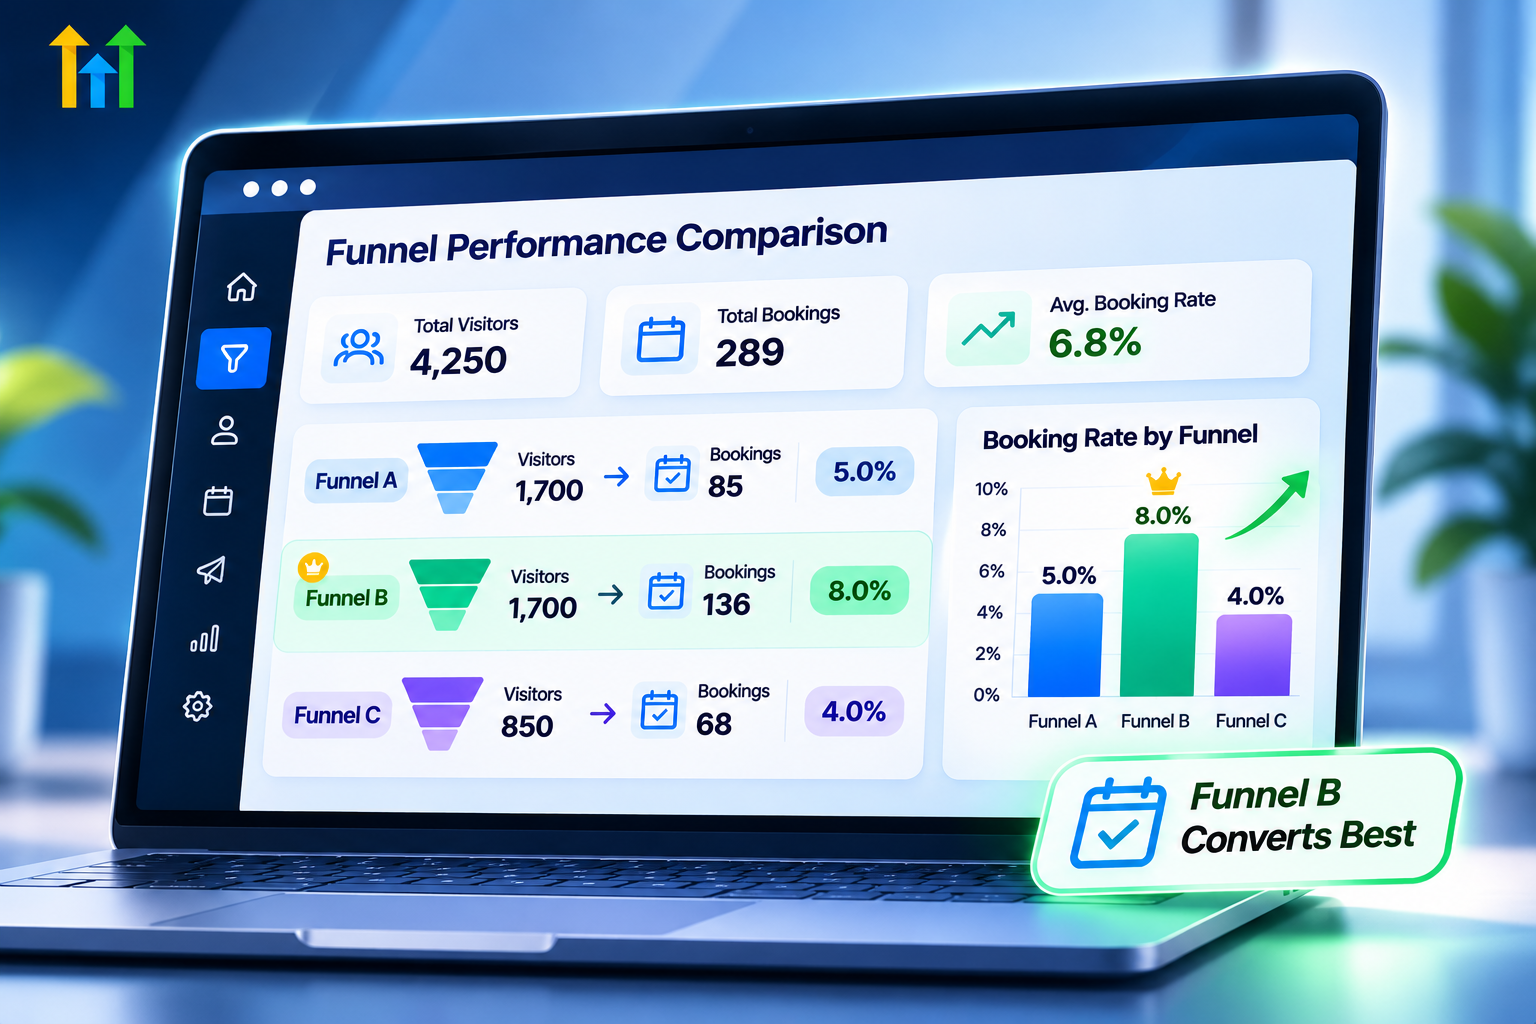
Measure Appointment Booking Rates Across Funnels: Step by Step Guide
How to Compare Appointment Booking Rates Across Funnels in GoHighLevel
Introduction
Getting traffic to a funnel is only part of the job. The more important question is what happens after someone lands on the page: Do they actually book an appointment?
If you have multiple funnels promoting the same service, comparing their appointment performance can reveal which pages are turning visitors into real sales opportunities and which ones need improvement.
GoHighLevel provides several reporting and attribution tools that can help you examine funnel traffic, opt-ins, appointments, sources, calendars, and appointment outcomes. However, comparing funnels correctly requires more than simply looking at total bookings.
In this guide, you'll learn how to compare appointment booking rates across funnels in GoHighLevel, which metrics matter, how to interpret the numbers, and how to avoid common reporting mistakes.
What Is an Appointment Booking Rate?
An appointment booking rate measures how effectively a funnel turns visitors into booked appointments.
A simple calculation is:
Appointment Booking Rate = Booked Appointments ÷ Unique Funnel Visitors × 100
For example, suppose Funnel A receives 1,000 unique visitors and generates 50 appointments.
Its appointment booking rate would be:
50 ÷ 1,000 × 100 = 5%
Now imagine Funnel B receives 600 visitors and generates 42 appointments.
Its rate would be:
42 ÷ 600 × 100 = 7%
Funnel B generated fewer total appointments, but it converted visitors into appointments at a higher rate.
This is why comparing raw booking numbers alone can produce the wrong conclusion.
Why Comparing Funnel Booking Performance Matters
Two funnels can promote the same offer and still produce very different results.
One may have:
More visitors but fewer bookings
Fewer visitors but a higher booking rate
Strong booking volume but high cancellation rates
Good appointment volume but poor show rates
Looking at only one number hides these differences.
GoHighLevel's funnel analytics can show page views, unique views, opt-ins, opt-in rates, sales, and other funnel-level information. HighLevel defines an opt-in broadly; it can include actions such as form or survey submissions, product purchases, or calendar bookings.
That distinction is important. "An opt-in rate is not automatically the same thing as an appointment booking rate."
If your funnel has multiple conversion actions, you need to isolate appointment activity when comparing booking performance.
The Key Metrics to Compare
Before comparing funnels, establish the same measurement framework for each one.
1. Unique Visitors
Start with the number of unique visitors reaching each funnel.
HighLevel's funnel statistics distinguish between total views and unique views. Unique views help provide a better denominator when calculating a visitor-to-booking rate.
2. Total Appointments
Next, determine how many appointments were booked from each funnel.
Total bookings tell you about volume, but they should always be considered alongside traffic.
3. Appointment Booking Rate
Calculate:
Bookings ÷ Unique Visitors × 100
Using the same formula across every funnel makes the comparison much more meaningful.
4. Cancellation and No-Show Rates
A funnel that generates many bookings is not necessarily the best-performing funnel if most appointments are later canceled or missed.
HighLevel's Appointment Report provides appointment counts by status and can help identify cancellation and rescheduling patterns.
5. Show Rate
If your sales process depends on attended appointments, also compare how many booked prospects actually show.
A funnel producing 100 bookings with a 40% show rate may be less valuable than one producing 70 bookings with an 80% show rate.
How to Compare Funnels in GoHighLevel
Step 1: Define the Funnels You Want to Compare
Start by selecting funnels that have a similar objective.
For example, you might compare:
Funnel A: Free consultation
Funnel B: Strategy session
Funnel C: Service assessment
Avoid comparing completely different offers unless your goal is specifically to understand overall business performance.
The closer the funnels are in purpose, audience, and offer, the more useful the comparison becomes.
Step 2: Set the Same Date Range
Use the same reporting period for every funnel.
For example:
October 1–31
Do not compare one funnel's last 30 days with another funnel's last six months.
Seasonality, advertising changes, promotions, and traffic sources can significantly affect the results.
HighLevel's funnel statistics allow you to use custom date ranges when reviewing performance.
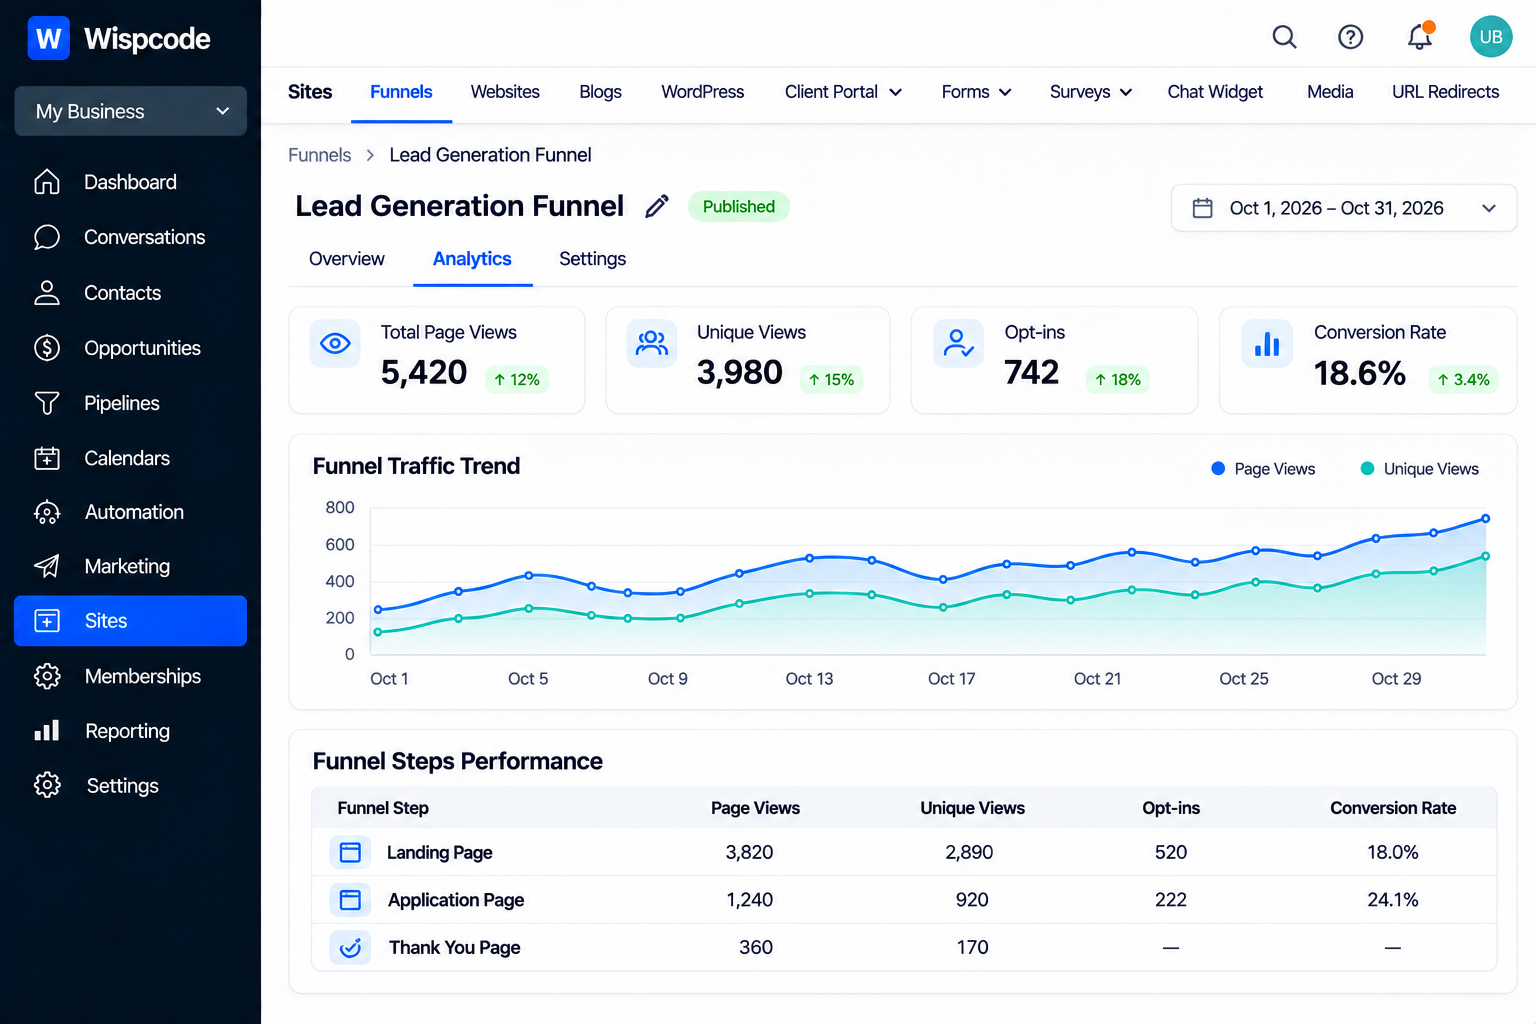
Step 3: Review Funnel Traffic
Open your funnel's statistics and review the visitor data.
HighLevel provides funnel-level information such as:
Total page views
Unique page views
Opt-ins
Opt-in rate
Sales
Revenue-related metrics
You can also drill into individual funnel steps to examine their performance.
Record the unique visitors for each funnel.
Step 4: Identify the Appointment Volume
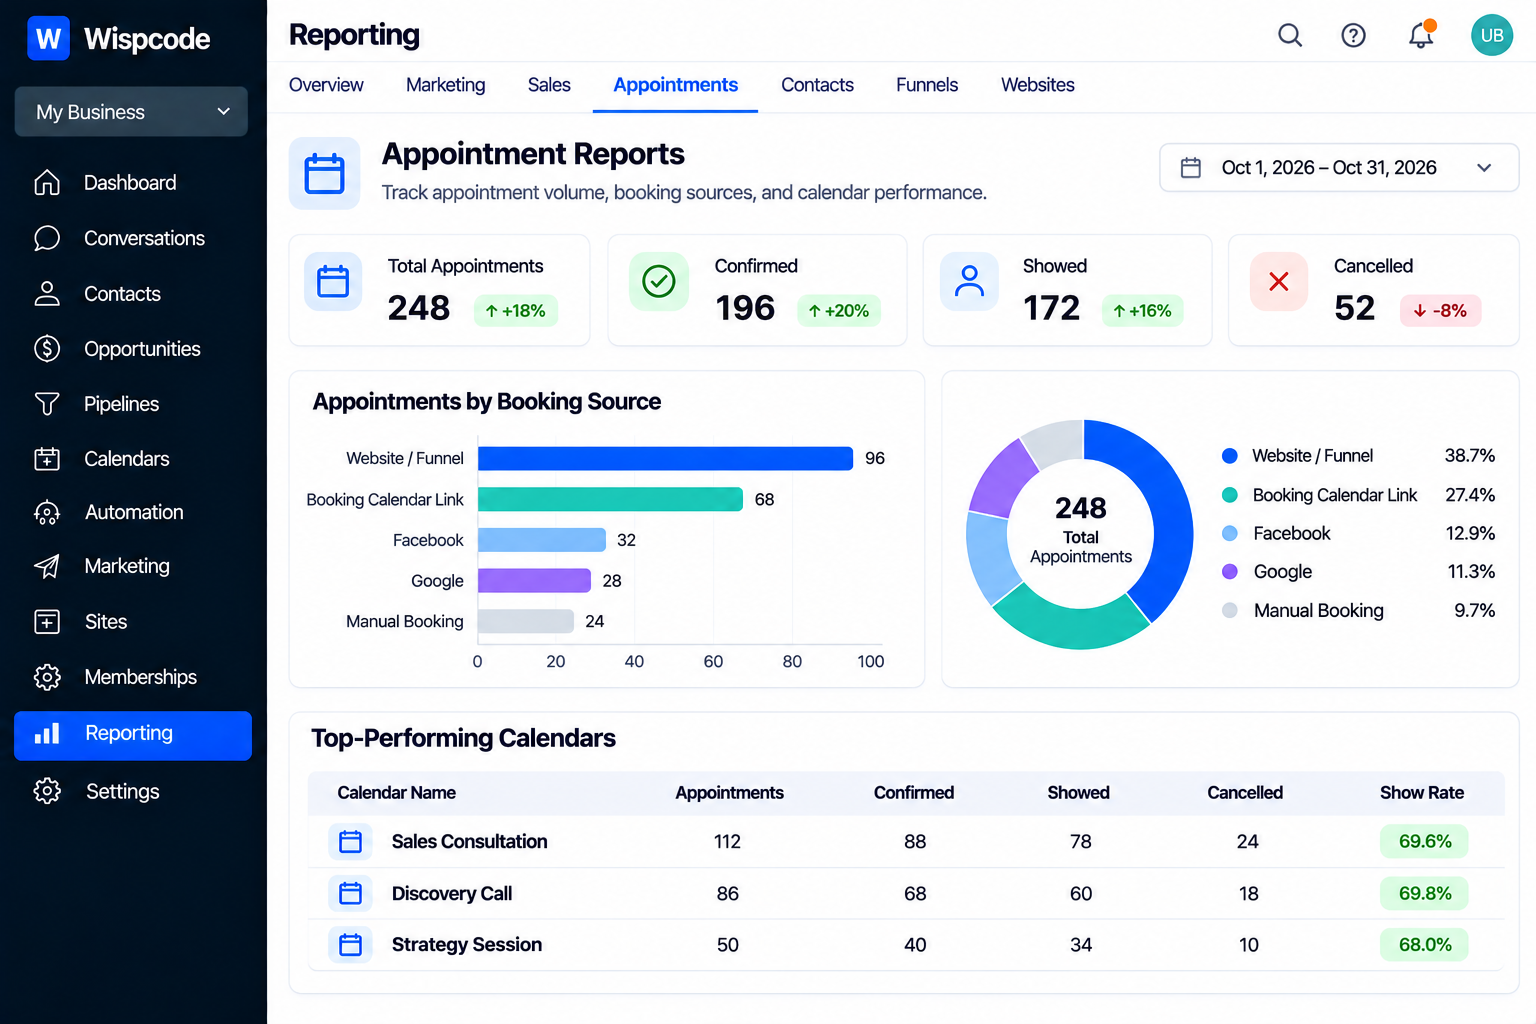
Next, review your appointment data.
HighLevel's Appointment Report includes appointment sources and channels, including funnels, and provides information such as appointment counts and top-performing calendars.
This can help you connect appointment activity with the funnel or source responsible for it.
The important point is to use the same definition of a booking across all funnels.
For example, decide whether your report includes only newly booked appointments or also rescheduled appointments.
Step 5: Calculate the Booking Rate
Once you have the numbers, calculate the rate for each funnel.
Example:
Funnel | Unique Visitors | Bookings | Booking Rate |
|---|---|---|---|
Funnel A | 1,000 | 50 | 5% |
Funnel B | 750 | 60 | 8% |
Funnel C | 1,500 | 60 | 4% |
In this example, Funnel C produces the same number of bookings as Funnel B but requires twice as much traffic.
That makes Funnel B more efficient at converting visitors into appointments.
Use Attribution to Understand Where Appointments Come From
Traffic volume alone doesn't explain why one funnel performs better.
Attribution can provide additional context.
HighLevel can capture attribution data when contacts complete supported actions such as form or survey submissions and calendar booking submissions. Attribution can use information such as the page URL, referring domain, and other session data to determine traffic sources.
This can help you investigate questions such as:
Which traffic source generated the booking?
Which funnel page was involved?
Are paid and organic visitors behaving differently?
Are certain campaigns producing more appointments?
Is one funnel receiving higher-quality traffic?
This becomes especially useful when multiple funnels are receiving traffic from different campaigns.
Don't Confuse Opt-In Rate With Booking Rate
This is one of the most important points when analyzing funnel performance.
HighLevel's "Opt-in Conversion Rate" is based on opt-ins divided by unique page views. But an opt-in can represent several types of conversions, including a form submission or appointment booking.
Suppose your funnel has:
1,000 unique visitors
150 form submissions
40 appointment bookings
A 15% opt-in rate does not mean the funnel has a 15% appointment booking rate.
The appointment booking rate is:
40 ÷ 1,000 × 100 = 4%
Keeping these metrics separate prevents misleading conclusions.
Compare Appointment Quality, Not Just Quantity
Once you know which funnel generates the most bookings, go one step further.
Look at what happens after the booking.
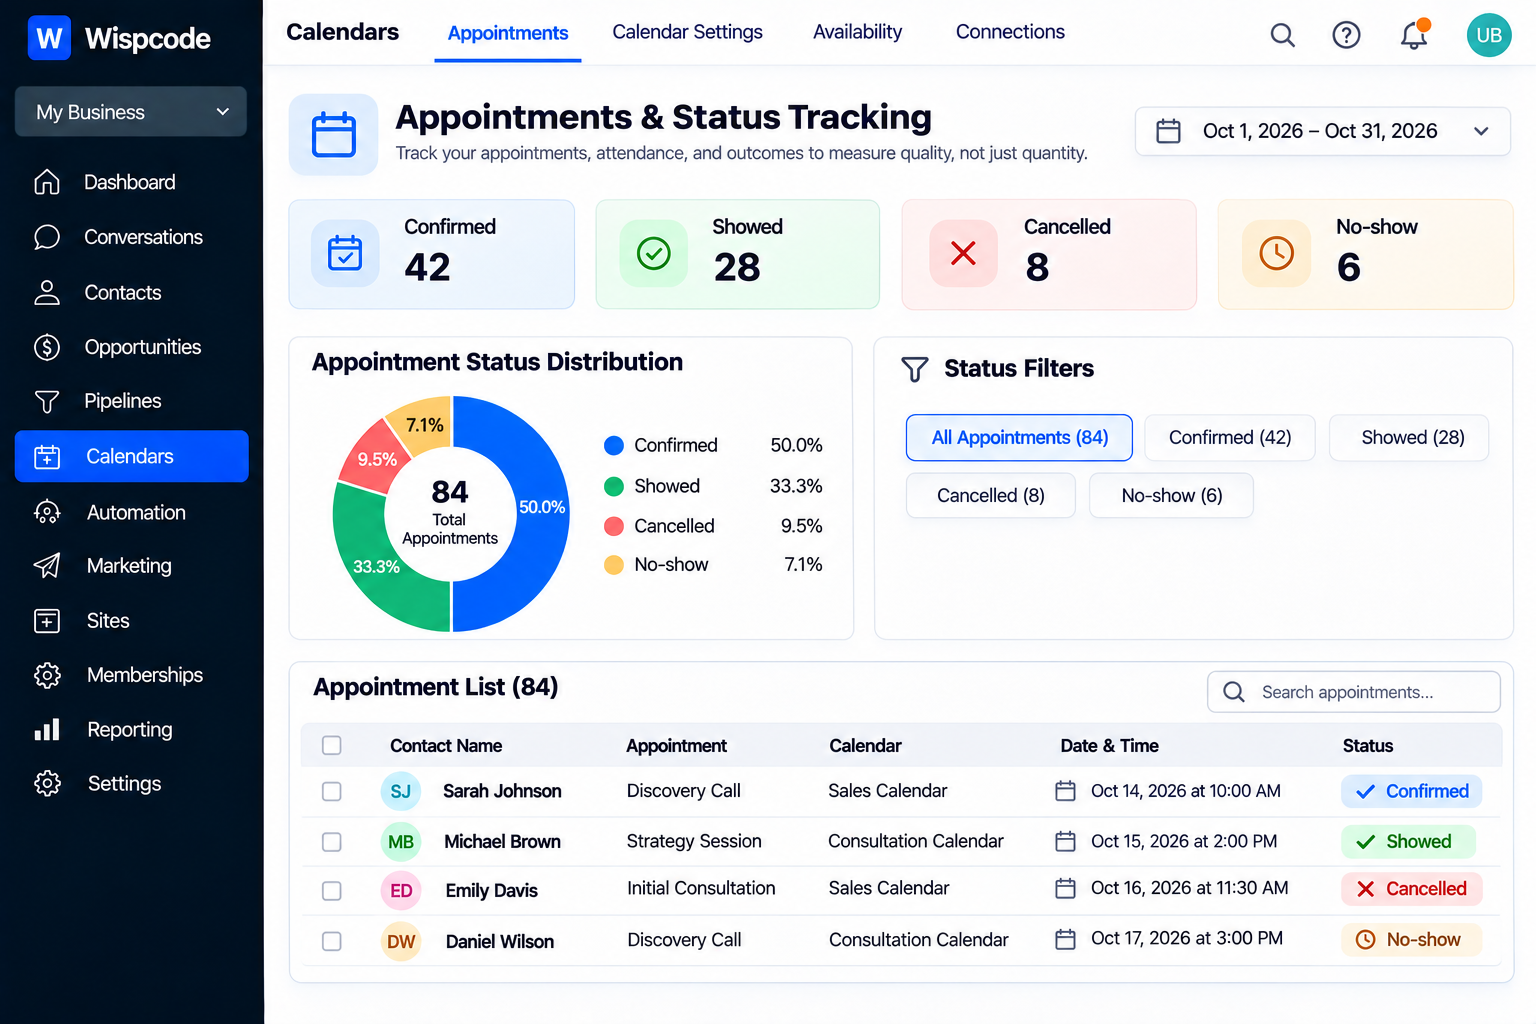
HighLevel supports appointment statuses such as New, Confirmed, Cancelled, Showed, No-show, and Invalid, depending on the appointment-status configuration. Workflows can also respond to appointment status changes.
This allows you to evaluate the quality of appointments generated by different funnels.
For example:
Funnel A
100 bookings
30 cancellations
20 no-shows
50 showed
Funnel B
75 bookings
10 cancellations
8 no-shows
57 showed
Funnel A wins on booking volume, but Funnel B produces more attended appointments.
If your business makes money from completed sales calls, Funnel B may be the better funnel.
Use Appointment Status Data for Deeper Analysis
Appointment statuses become particularly useful when comparing funnel quality.
You can examine:
New appointments
Confirmed appointments
Cancellations
Showed appointments
No-shows
Other configured statuses
HighLevel's Appointment Status workflow trigger can also respond to appointment status changes, making it possible to automate follow-up based on outcomes such as cancellations, shows, and no-shows.
This does not replace reporting, but it can help ensure your CRM records consistently reflect what happened after someone booked.
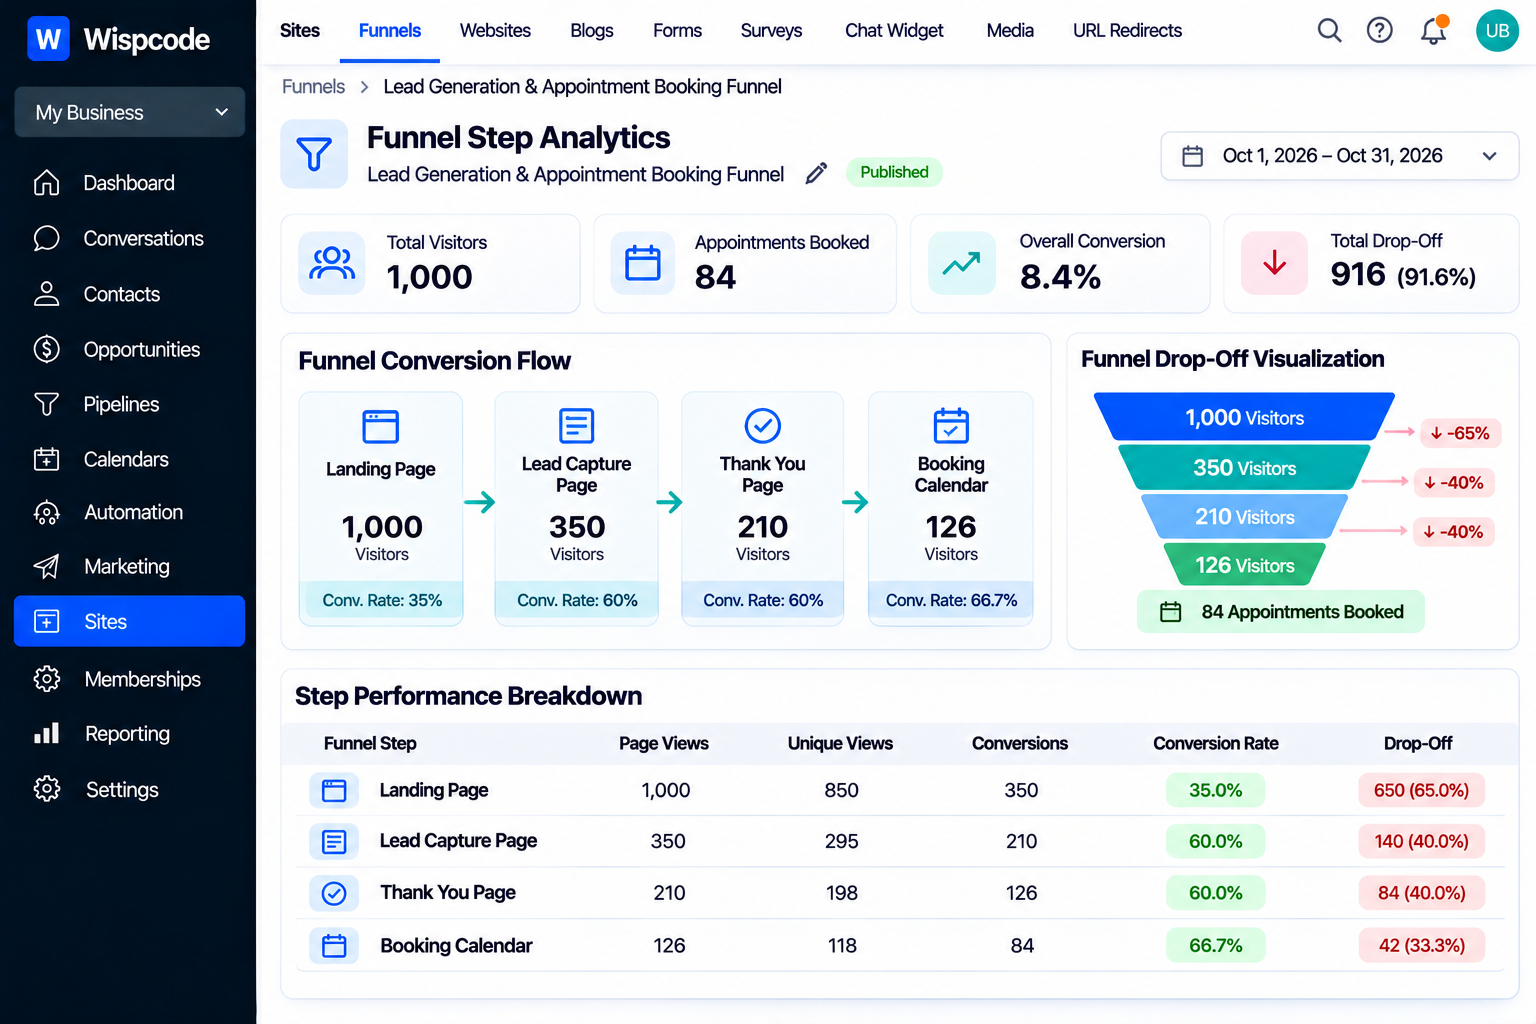
Look at Funnel Steps, Not Just the Entire Funnel
A funnel may have several pages before the visitor reaches the booking calendar.
For example:
Landing Page → Offer Page → Qualification Form → Calendar
If bookings are low, the problem may not be the calendar itself.
Visitors could be dropping off earlier.
HighLevel's funnel analytics allows you to examine performance at the funnel-step level, including page views and conversion information.
This helps you ask better questions:
Is the landing page attracting the right visitors?
Are visitors reaching the booking page?
Are they completing the form?
Is the offer clear?
Is the calendar receiving enough qualified traffic?
Instead of simply saying, “The funnel isn't converting,” you can identify where the conversion process is weakening.
Compare Similar Traffic Sources
Traffic quality can have a major effect on booking rates.
For a fair comparison, consider whether each funnel receives similar traffic.
For example, comparing:
Google Ads traffic
Facebook Ads traffic
Organic traffic
Referral traffic
can produce very different results.
A funnel receiving highly targeted search traffic may naturally produce a different booking rate than one receiving broad social traffic.
Use attribution information where available to understand the traffic sources behind your results.
Common Mistakes When Comparing Funnels
Comparing Total Bookings Only
More bookings do not automatically mean better conversion performance.
Always consider traffic volume.
Using Different Date Ranges
Keep reporting periods consistent.
Mixing Different Offers
A high-ticket consultation and a free discovery call should not automatically be treated as equivalent conversions.
Ignoring Cancellations and No-Shows
A booking is only one stage of the customer journey.
Treating Opt-Ins as Appointments
HighLevel's opt-in metric can include multiple conversion types, so verify what the number represents before using it as a booking metric.
Changing Multiple Variables at Once
If you change the offer, page design, traffic source, and booking process simultaneously, it becomes harder to determine what actually caused a performance change.
A Simple Funnel Comparison Framework
For ongoing reporting, create a simple scorecard for each funnel.
Track:
Unique visitors
Total bookings
Appointment booking rate
Confirmed appointments
Cancellations
No-shows
Showed appointments
Traffic source
Calendar used
Revenue or sales generated, where applicable
This gives you a much clearer picture than looking at traffic or bookings alone.
For example:
Funnel A: 5% booking rate → 70% show rate
Funnel B: 7% booking rate → 50% show rate
Funnel B looks stronger at the booking stage, but Funnel A may generate more attended appointments.
The right metric depends on the business outcome you're trying to improve.
Best Practices for Comparing Appointment Funnels
Use Consistent Definitions
Decide what counts as a booking, show, cancellation, and qualified appointment before analyzing the data.
Compare Enough Data
Avoid making major decisions from a handful of appointments. Give each funnel enough traffic and activity to produce a meaningful sample.
Separate Traffic Quality From Funnel Quality
A funnel may perform poorly because of the traffic it receives rather than because of the page itself.
Review the Entire Appointment Journey
Look beyond the initial booking and examine confirmation, cancellation, no-show, and show rates.
Keep Tracking Consistent
Use consistent attribution and naming conventions so your reports remain understandable as you add more funnels.
Test One Major Change at a Time
When optimizing a funnel, isolate meaningful changes whenever possible. This makes it easier to understand what influenced performance.
Frequently Asked Questions(FAQ's)
1. What is the appointment booking rate for a funnel?
It is the percentage of unique funnel visitors who book an appointment. A basic calculation is booked appointments divided by unique visitors, multiplied by 100.
2. Does GoHighLevel show appointment booking rates automatically?
GoHighLevel provides funnel statistics and appointment reporting, but appointment booking rate may need to be calculated by combining the relevant visitor and appointment data. Funnel opt-in rate should not automatically be treated as appointment booking rate because opt-ins can include multiple conversion actions.
3. Can I see which funnel generated appointments?
HighLevel's Appointment Report includes appointment sources and channels, including funnels, which can help identify where appointments originated.
4. Should I compare bookings or showed appointments?
Ideally, compare both. Bookings measure the funnel's ability to generate appointments, while showed appointments provide a better view of how many scheduled opportunities actually reached the appointment stage.
5. How often should I compare funnel performance?
Review funnel performance regularly, but avoid making decisions from very small data sets. Monthly reviews can work well for many businesses, while high-volume campaigns may justify more frequent analysis.
Conclusion
Comparing appointment booking rates across funnels is about more than finding the funnel with the highest number of bookings.
You need to consider "unique visitors, booking volume, conversion rate, attribution, appointment status, cancellations, no-shows, and showed appointments" to understand the full picture.
GoHighLevel provides funnel analytics, appointment reporting, attribution data, and appointment-status tools that can support this analysis.
The most useful question is not simply:
“Which funnel gets more appointments?”
It is:
“Which funnel turns the right visitors into valuable, attended appointments?”
Once you start measuring performance this way, your funnel data becomes much more useful for making smarter marketing and sales decisions.
Need Expert Help with GoHighLevel?
New to GoHighLevel and ready to get started? Buy your GoHighLevel account here and launch with confidence.
Already know what you need and want our team to handle everything, from complete setup and customization to funnels, workflows, automations, CRM, and pipelines? Click here.